Filtering EMG Data using Dataquest ART
Dataquest A.R.T. reached its End of Life (EOL) in July 2015 and is no longer available for purchase. For information on continued support, please see DSI Software Support Lifecycle policy for software product support and discontinuation guidelines.Due to technology upgrades and software compatibility, DSI cannot guarantee the functionality of Dataquest ART on computers manufactured after July 2015.
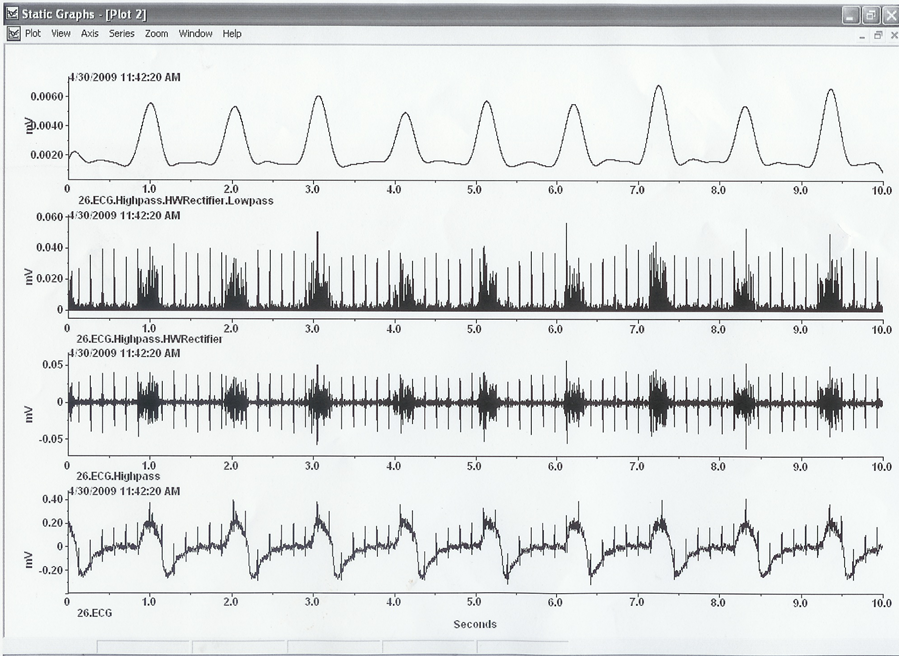
- The bottom most signal is the EMG signal
- The next one up is the EMG filter with a High Pass filter at 50-75 Hz. To do this:
- Select the EMG signal
- Right-click and select Filter Actions - High Pass
- Enter a Low end cutoff of 50-75 Hz
- Click OK
- A new data series will be added to the top of your Analysis window labeled Animal ID.EMG.Highpass
- The 3rd graph from the bottom is that high pass filtered data Half Wave Rectified. To do this:
- Select the filtered EMG signal from step two above (series name Animal ID.EMG.Highpass)
- Right-click and select General Actions - Half Wave Rectification
- A new data series will be added to the top of your Analysis window labeled Animal ID.EMG.Highpass.HWRectification
- The top graph is the Half Wave Rectified signal from step 3 filtered with a low pass filter
- Select the signal generated in step 3 above (series name Animal ID.EMG.Highpass.HWRectification)
- Right-click and select Filter Actions - Low Pass
- Enter a High end cutoff of 3 Hz
- Click OK
- A new data series will be added to the top of your Analysis window labeled Animal ID.EMG.Highpass.HWRectification.Lowpass
- Next you can graph all of these together on one graph, as shown in the manual by:
- Hold the control key down on the keyboard and select all four series generated in the above steps, to highlight the four data series
- Right-click and select Display Actions - Plot
- Choose to Plot by Series Order
- Click OK
Can't find what you're looking for? Contact Us
Comments
0 comments
Please sign in to leave a comment.