Visual Examination of JET RIP Data via Konno-Mead Method
Summary
DSI’s Ponemah software is able to visualize JET Respiratory Inductive Plethysmography (RIP) data for
synchrony, asynchrony, and paradoxical breathing patterns using the method of Konno and Mead(1)
wherein Chest and Abdomen excursions are plotted on separate axes of a XY loop plot. This document
will explain the steps required to perform this visualization.
Method
To display a plot of chest and abdomen excursions one should set up a graph page per the following
conventions and similar to the representation in Figure 1.
- Enable Page = Checked
- Type = XY-Loop
- X = The channel associated with the abdomen belt for a specific animal
- Y = The channel associated with the chest belt for the same specific animal
- Presentation = Input for both the Abdomen and Chest Channels
(1) Konno K, Mead J. Measurement of the separate volume changes of ribcage and abdomen during breathing. J Appl Physiol 1967; 22:407-22.
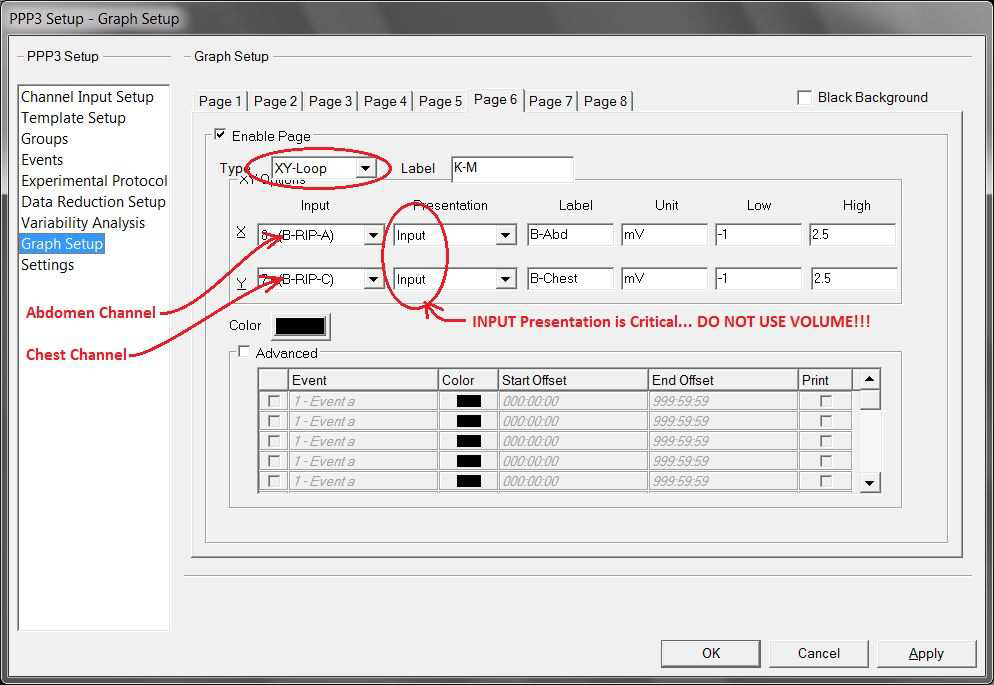
Figure 1 - Graph Setup
Example Data - Normal
JET RIP data collected on a beagle during a period of time with no activity or artifact is presented below.
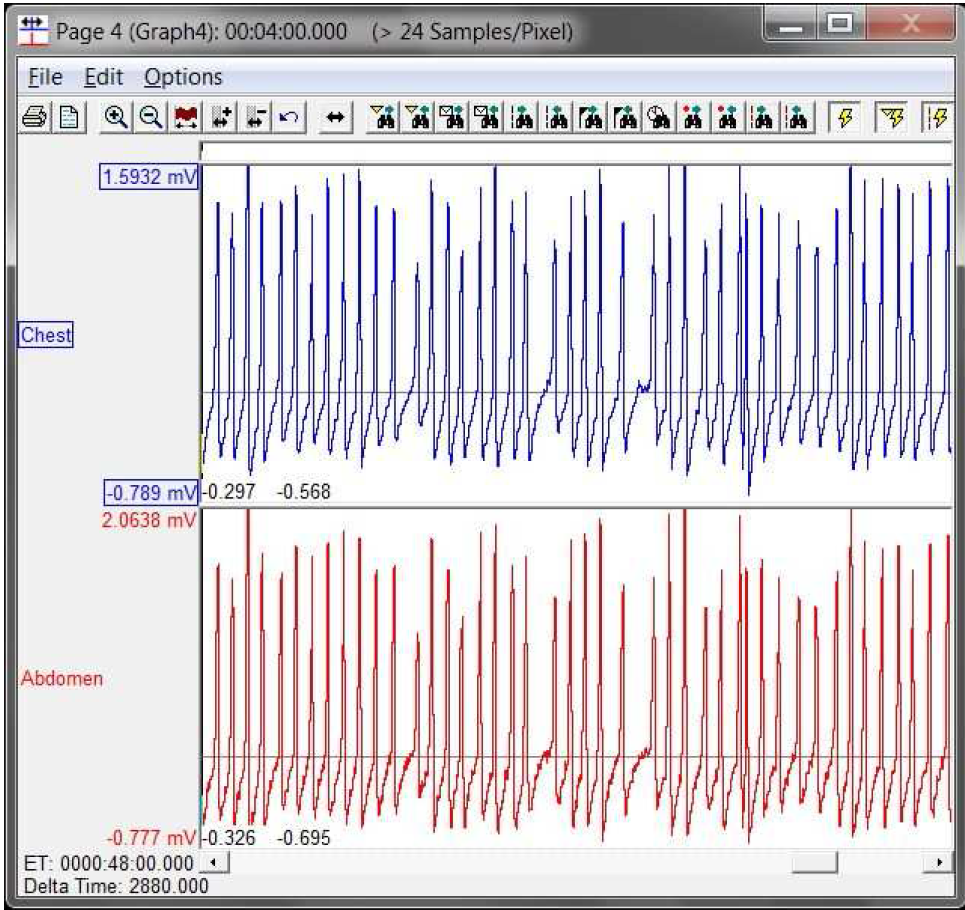
Figure 2 - Plot of Chest and Abdomen excursions (4 minute period)
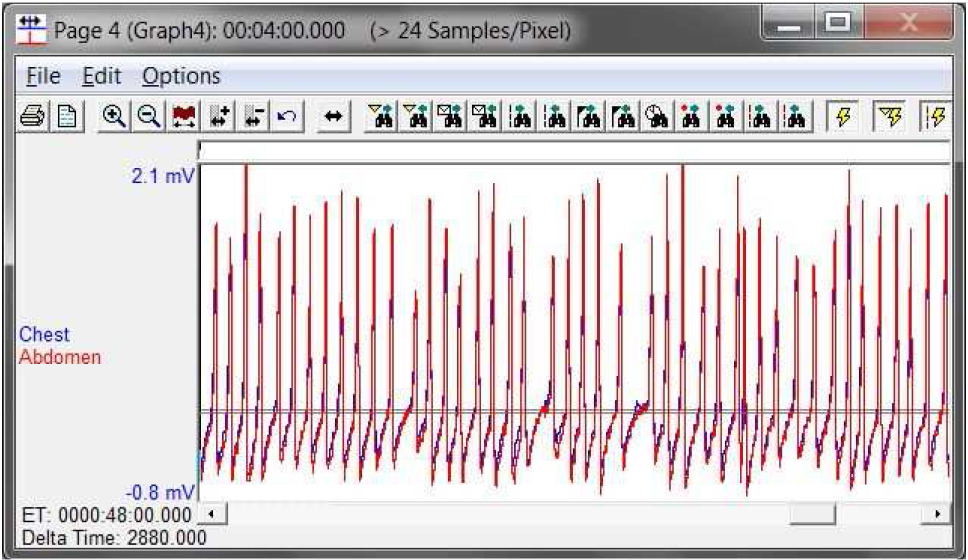
Figure 3 - Plot of above – Signals Overlaid
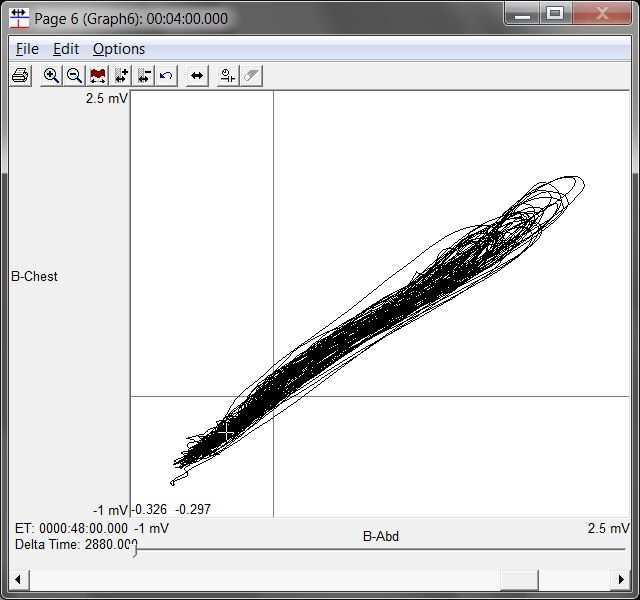
Figure 4 - Plot of Chest vs. Abdomen excursions (4 minute period)
Example Data - Asynchrony
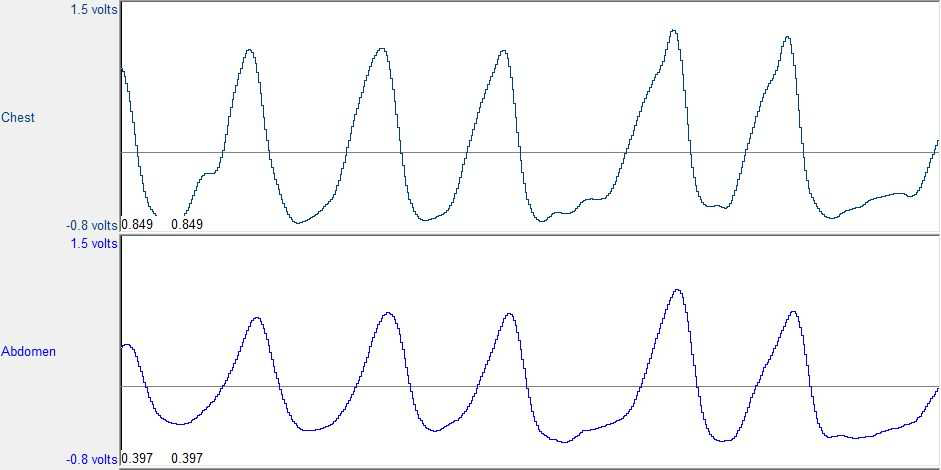
Figure 5 - Plot of Chest and Abdomen excursions (10 second period)

Figure 6 - Plot of above – Signals Overlaid
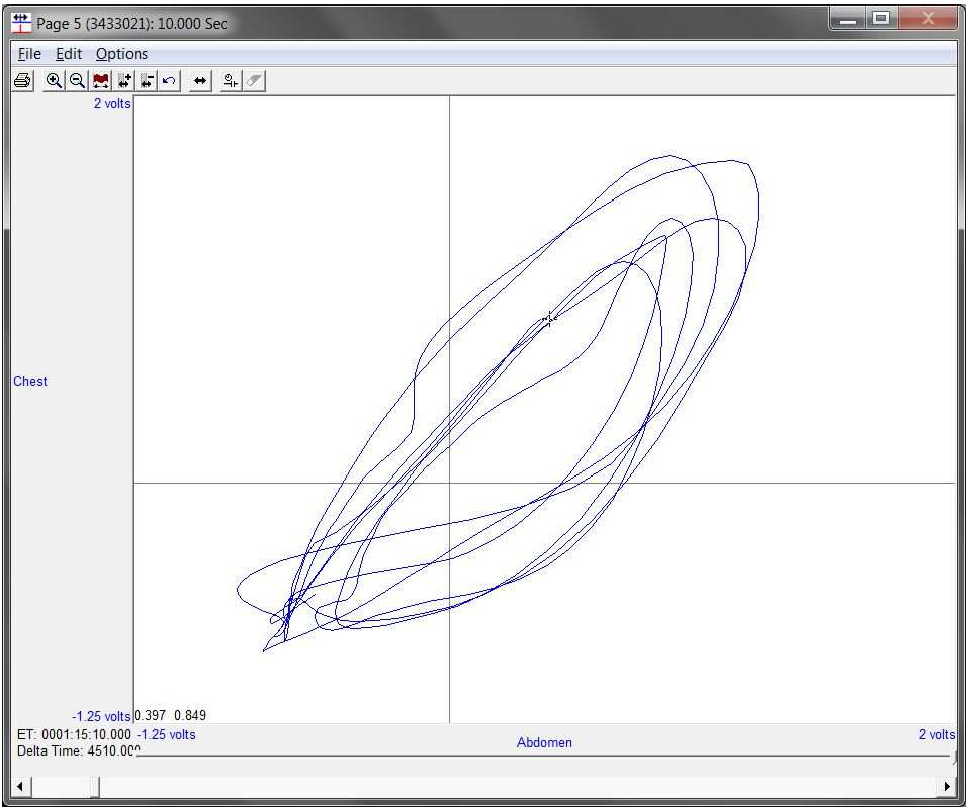
Figure 7 - Plot of Chest vs. Abdomen excursions (10 second period)
Comments
0 comments
Please sign in to leave a comment.