How to create a Poincare Plot using Ponemah Custom Derived Parameter
Poincare plots can easily be created using the Ponemah Customer Derived Parameter feature.
Please note, Custom Derived Parameter is available in Ponemah 5.x series v5.40 and later.
To create a Poincare Plot:
- Open data using Ponemah Review
- Create the RR-1 (n+1) parameter
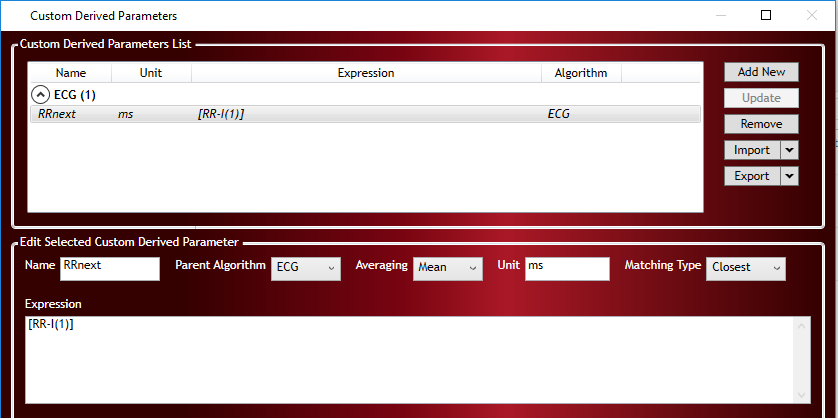
- Select Setup | Custom Derived Parameter
- Click Add New button
- Enter Name: RRnext
- Select Parent Algorithm: ECG
- Select Averaging: Mean
- Enter Unit: ms
- Ignore Matching Type
- Enter Expression: [RR-I(1)]
- (1) indicates the system should report the next cycle
- (-1) could be used to have the system report the previous cycle
- Click Update button
- Click OK
- Create Scatter Plot of RR-1(N+1) vs RR-I
- Select Setup | P3Setup
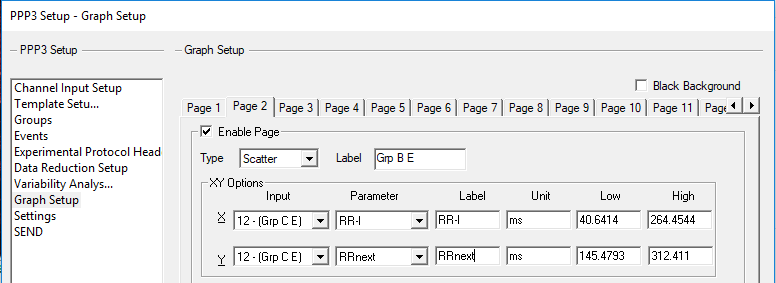
- Select Graph Setup
- Select an unused graph page
- Enable the graph page by clicking (checking) the associated checkbox
- Select Scatter using the Type dropdown
- Define X axis:
- Select ECG channel for Input
- Select RR-I for Parameter
- Enter Label RR-I
- Define Y axis:
- Select ECG channel for Input
- Select RRnext for Parameter
- Enter Label RRnext
- Click OK
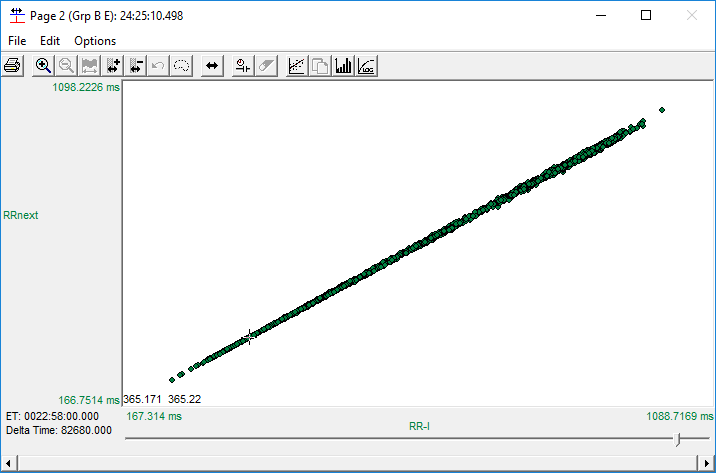
- Navigate to the generate graph page
- Double-click the graph pane and select AutoScale
- To include the RRnext parameter in the Excel output upon saving the mark section, it must first be enabled/added to the Derived List View.
- Select Setup | P3Setup
- Select Channel Input Setup
- Select the ECG channel(s) desired
- Select Derived Parameters button
- Ensure RR-1 is enabled, if not check the box to enable it
- Check the checkbox associated with RRnext
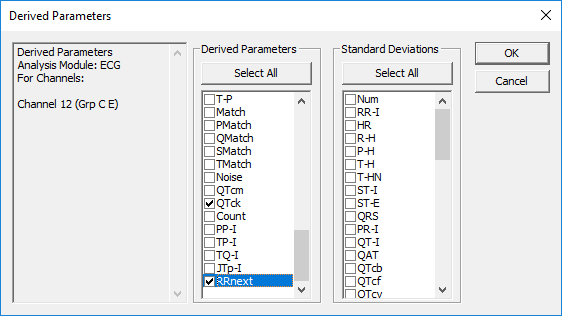
- Click OK
- Click OK
- Select Functions | Save Marks Section
- Enter a unique Mark Section name and ensure Save Derived Data checkbox is enabled
- Click OK
- Navigate to the Ponemah Data folder to obtain Excel file with RR-I and RRnext parameter data available for further processing
Note: further analysis for SD1 and SD2 calculations may be performed from the data in the Excel output.
Can't find what you're looking for? Contact Us
Comments
0 comments
Please sign in to leave a comment.