Understanding Bad Data Marks Percentage
Background
The Bad Data Marks Percentage feature (BDM Percentage) allows the user to determine the overall percentage of data removed from analysis using the Noise attribute as well as manually added Bad Data Mark sections. This feature is available in both the Ponemah v5.x and v6.x platforms when in Review mode.
The BDM Percentage feature provides an overview of data removed for the entire collection as well as the percentage at user defined intervals. This allows users determine if an adequate amount of data exists in the collection for statistical analysis as well as providing insight into areas that may require additional review.
It is important to note that BDM Percentage does not take into account cycles that are not marked due to incorrect attribute settings. If a cycle is not marked, it is not considered “bad” data.
Accessing BDM Percentage
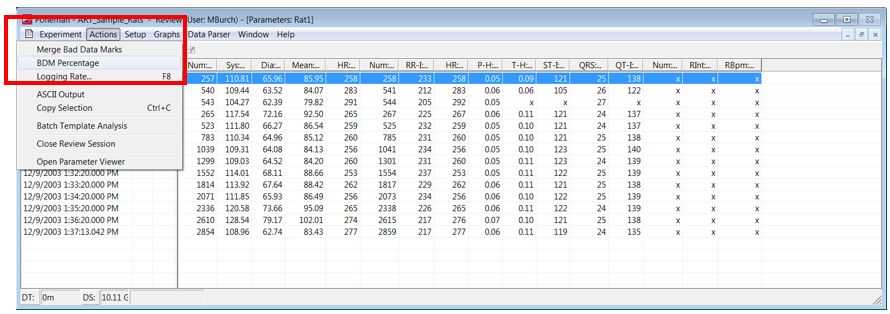
The following demonstration will be performed using Ponemah v6.33. The functionality and menu is the same as in v5.20. From the Actions pull-down menu (Functions menu in v5.20), select BDM Percentage.

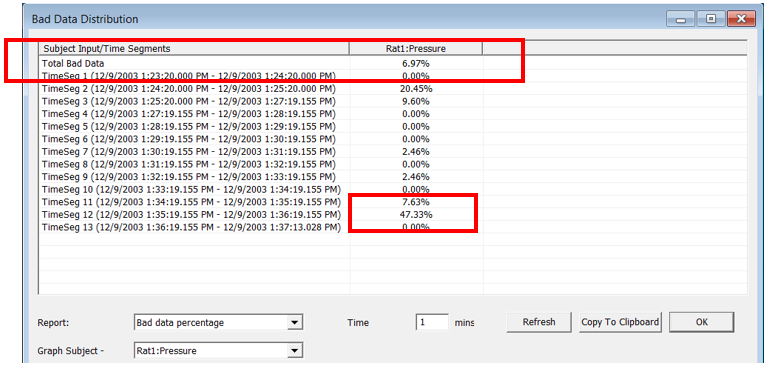
The following dialog will appear displaying one minute time segments along with a graphical component showing the distribution of bad data across the entire collection.

Using Bad Data Marks Percentage
The top portion of the dialog displays the percent data loss in one minute averages, by default. The total data loss for the signal is calculated and displayed in the first row in the table (Total Bad Data). Below shows the Pressure signal for Rat 1. The Total Bad Data for the pressure signal in this collection is 6.97%.
Additionally, we can easily find areas with high data loss. Segment 12 shows that 47.33% of the data in that one minute average was removed from analysis.

Below the table data, filters are present to provide the desired channel and percent loss information. Using the Graph Subject pull-down arrow, users can select any channel that has been loaded into Review. By selecting an input, in this example Rat1 ECG (see below), the table and graphical information are automatically updated to reflect that selected channel. If a change to the Time interval is desired, enter the time in the edit field and select the Refresh button to update the calculations and graphical component.
Note: If using Ponemah version 5.20, all percent loss information (Time Segment information) will be present for all channels loaded into Review. Using the Graph Subject pull-down menu will update the graphical component to the selected channel.

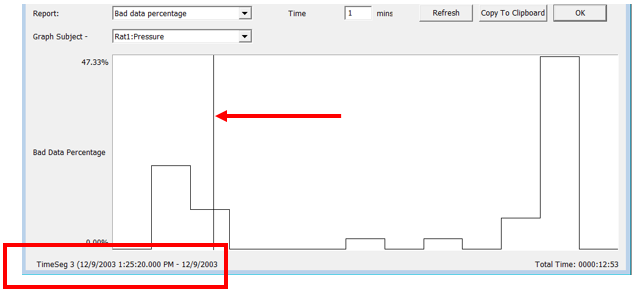
In addition to using the calculated information to find areas of high data loss, you can quickly find this information by placing your cursor on a desired point in the graph window. Left click you mouse to place a cursor on the graph in the desired location. Time Segment information will be displayed for that point below the graph.

If desired, this time can be used as a reference point to return to the waveform data and determine if additional analysis could decrease the amount of data removed.
Comments
0 comments
Please sign in to leave a comment.