Printing multiple lines of waveforms onto a single printout with Ponemah
To print multiple lines of waveform data onto a single printout, the user will need to use the Page View Graph.
To print in v5.20:
- Launch Ponemah v5.20.
- Select File | Printer Setup.
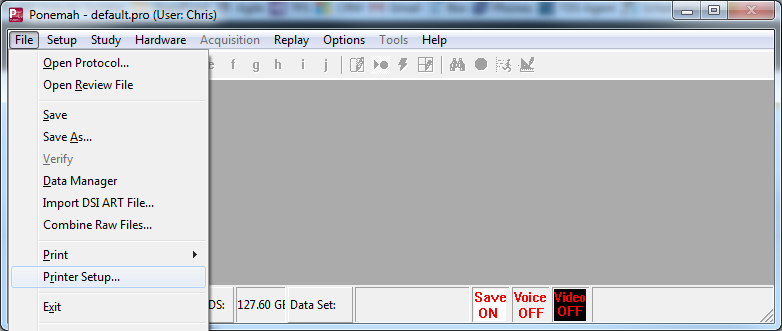
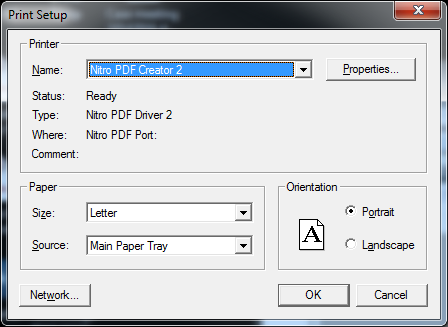
- Select the appropriate printer or PDF creator and click OK.
- Open a Review file.
- Select Setup | P3 Setup | Graph Setup.
- Select the Graph Page to use for the desired printing.
- Enable the page and define the graph Type to Page View.
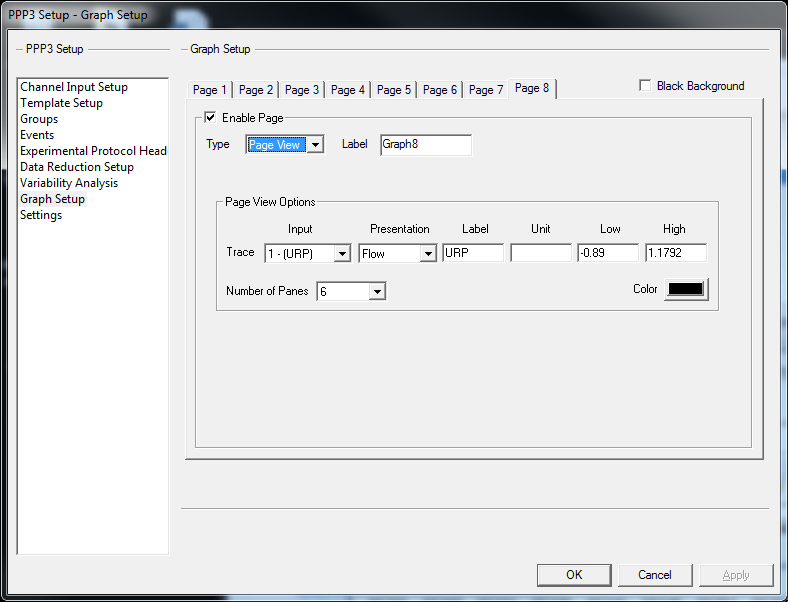
- Choose the desired Input channel you want to print.
- Define the desired Number of Panes (lines of waveform data). In this example, I selected 6, as I want to set the x-axis time to 60 seconds to get 6 lines of waveform data, each at 10 seconds long.
- Click OK.
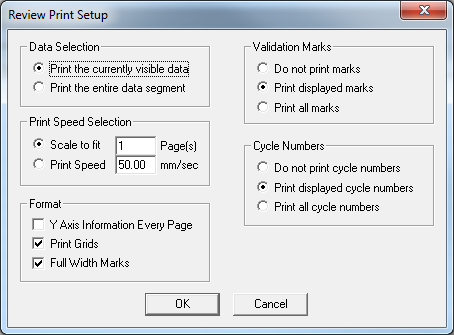
- From the main Ponemah window, select Setup | Review Printer Setup.
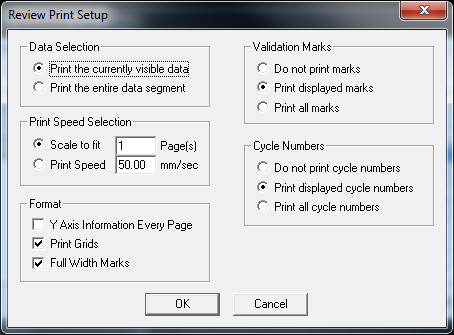
- Make your selections for how you want to data to be printed.
- Scale y and x axes.
- Select the data you wish to print.
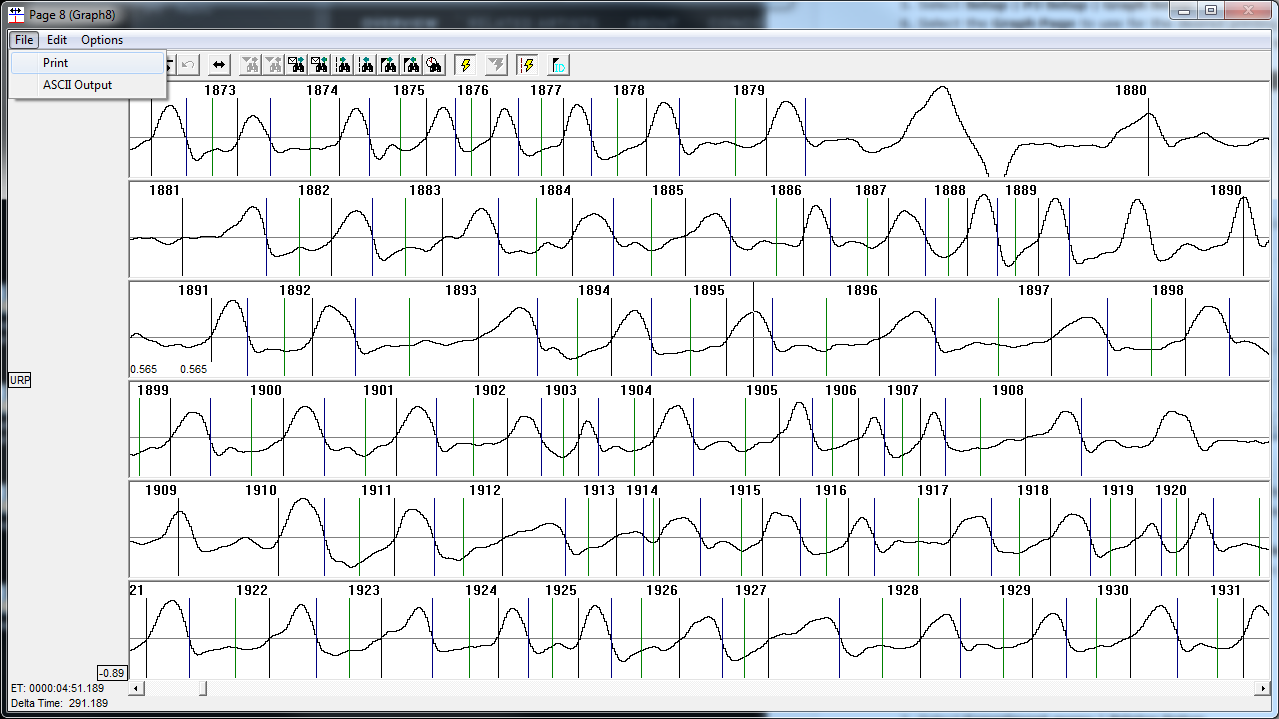
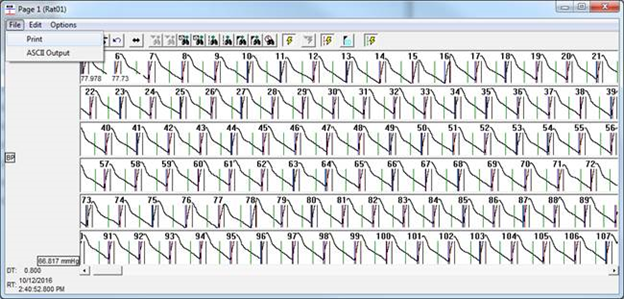
- From the Page View graph page, select File | Print.
To print in v6.x:
- Open Ponemah to the appropriate experiment
- Select Experiment menu | Printer Setup…
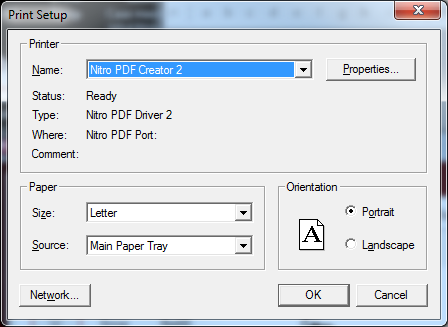
- Select the appropriate printer or PDF creator and click OK.
- Select Actions menu | Start Review…
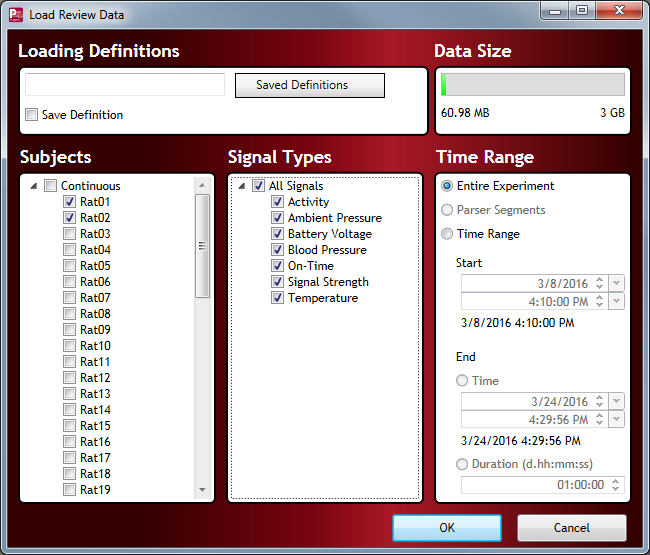
- Select the appropriate Subjects and channels to load into Review.
- Click OK.
- Select Graph menu | Graph Setup…
- Select the Graph Page to use for the desired printing.
- Enable the page and define the graph Type to Page View.
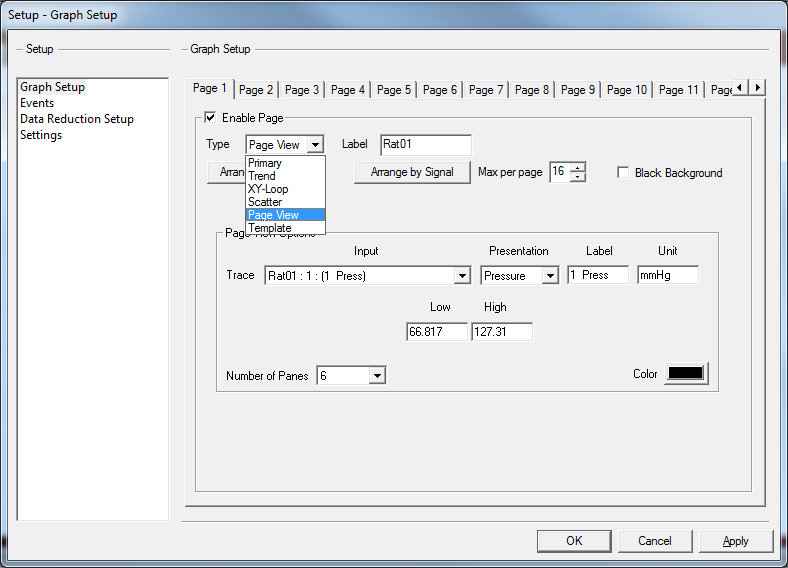
- Choose the desired Input channel you want to print.
- Define the desired Number of Panes (lines of waveform data). In this example, I selected 6, as I want to set the x-axis time to 60 seconds to get 6 lines of waveform data, each at 10 seconds long.
- Click OK.
- From the main Ponemah window, select Experiment | Review Print Setup and define the desired settings on the look and feel of the print.
- From the Page View graph page you created, scroll to the section you wish to print, assuming it is a subsection of the entire waveform, and scale the y-axis as desired.
- Select the graph page’s File menu | Print.
Positioning Data
Since the option to print the visible portion of the screen only exists, the goal is to get the start of the data section of interest to the top pane. To do this:
- Select the data of interest by click-and-dragging starting at the first cycle desired to be included in the print out and ending at the end of the visible region.
- This will zoom in, so scale the x-axis back to 10 seconds.
- If the cycle desired to starting the printout with is not near the beginning of the top pane in the visible region of the graph, repeat steps 1 and 2 a second time.
- Alternatively, use the scroll wheel to move the desired cycle as close to the beginning of the top pane as possible, then perform steps 1 and 2 above.
Can't find what you're looking for? Contact Us
Comments
0 comments
Please sign in to leave a comment.